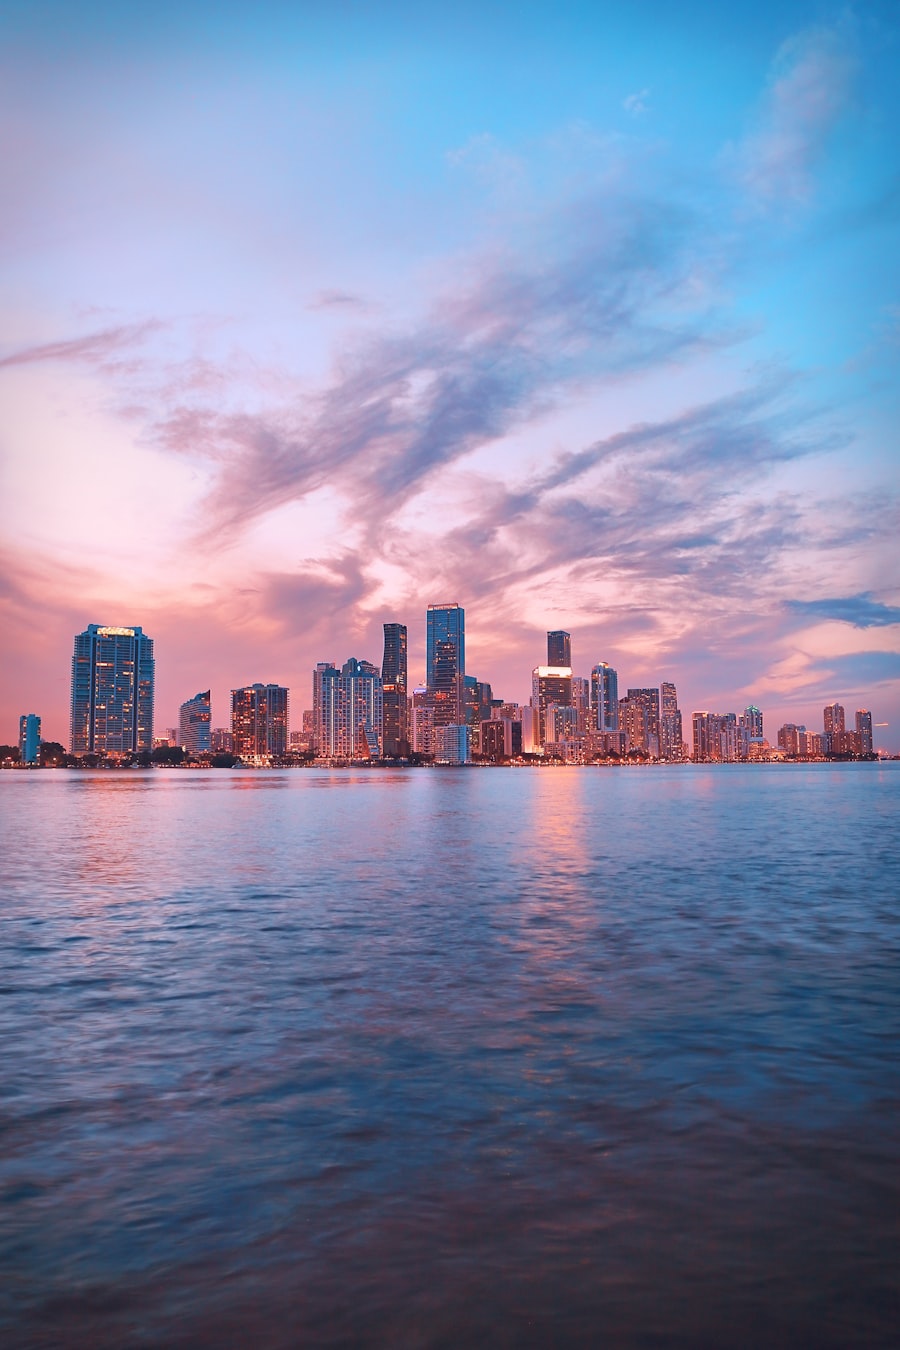
Miami Beach
Miami Beach, by the numbers.
Island inventory where the water view, not the floor plan, sets the price. Everything below is our own data for this area, not a county-wide average borrowed from somewhere else.
Island inventory where the water view, not the floor plan, sets the price. Everything below is our own data for this area, not a county-wide average borrowed from somewhere else.
The live grid, already filtered to this area.
The Miami Beach page on the live site — inventory, the local write-up and the market picture for this area.
Measured off our own active inventory the day this page was built. Asking prices, plainly labelled as asking prices.
Homes for sale in Miami Beach in our own feed right now, not a portal count.
See them →Middle of the marketHalf the asking prices in Miami Beach sit above this and half below. It is what sellers want, not what homes have traded for.
What it really sold for →Per square footThe middle asking price per foot here. Compare it against the sold number before you decide an ask is fair.
Open prices →Typical sizeThe middle home size on the market here, so the price above has something to sit against.
Browse Miami Beach →Ask them before you tour anything here, not after.
Real sold and signed prices per square foot for this area — so you can tell a fair ask from a hopeful one.
Open prices →RentFree accountAchieved rents on the map, by dollars a month or dollars a foot.
Open the rent map →NearbySchools, shops, the water and the drive times.
Open the map →ZoningWhat the lot actually allows — the question that decides whether a tired house is a teardown or a bargain.
Open zoning →One call and we set up the showing. No account, no spam — and if you would rather we just send a hand-picked list you can open on your phone, say so.