New Home Sales Report, August 2026: What to Watch
Comes out: Thursday, September 24, 2026 at 10:00 a.m. ET
Published by: U.S. Census Bureau
New homes sold jump to 684K, but sales trail last year
The count of brand-new houses sold across the country rose to 684K in August 2026. That is up from 643K the month before. So more new houses found buyers than in the prior month.
But the picture over a full year is different. A year ago, 698K new houses sold. So sales are down from where they were 12 months ago.
Prices moved in a similar way. The median price of a new house was $393,700 in August 2026. "Median" just means the middle price, where half cost more and half cost less. That is up a little from $392,200 the month before, but down from $417,900 a year ago.
Here is what this means for you in South Florida. When builders sell fewer new homes than last year, they often cut prices or offer help with the loan to close a deal. Those deals pull down what nearby sellers can ask. If you are buying, you may have more room to negotiate. If you are selling an older home, you are now competing with builders who can sweeten the offer.
Local asking prices already show this pull. In Broward, the typical asking price is $380,000, down from $400,000 a year ago. In Miami-Dade it is $589,000, down from $599,000. In Palm Beach it is $480,000, down from $485,000. Want to know what your home would fetch today? Call The Neuman Group at 954-228-5001.
On Thursday, September 24, 2026 at 10:00 a.m. ET, the U.S. Census Bureau puts out its New Residential Sales report. People often call it the new home sales report. It counts how many brand-new houses sold across the country.
This page is up before the new number lands. So if you searched for it, you are in the right spot. We will not guess tomorrow's figure. Instead, we will explain what the report means and how it can touch your wallet here in South Florida.
Why should a normal person care? Because when fewer new houses sell, builders start cutting prices to move them. Those cuts can pull down prices on nearby homes too. That matters whether you are buying, selling, renting out a place, or paying a mortgage.
What this report actually measures
The report counts sales of brand-new houses. Not used homes. Just ones a builder finished and sold. It also shows the middle price of those new houses. Middle price means half sold for more and half sold for less.
Builders sell when buyers can afford the monthly payment. When money gets tight, sales slow down. Builders then offer deals to keep houses moving. So this report is an early read on how buyers are feeling.
What the charts show right now
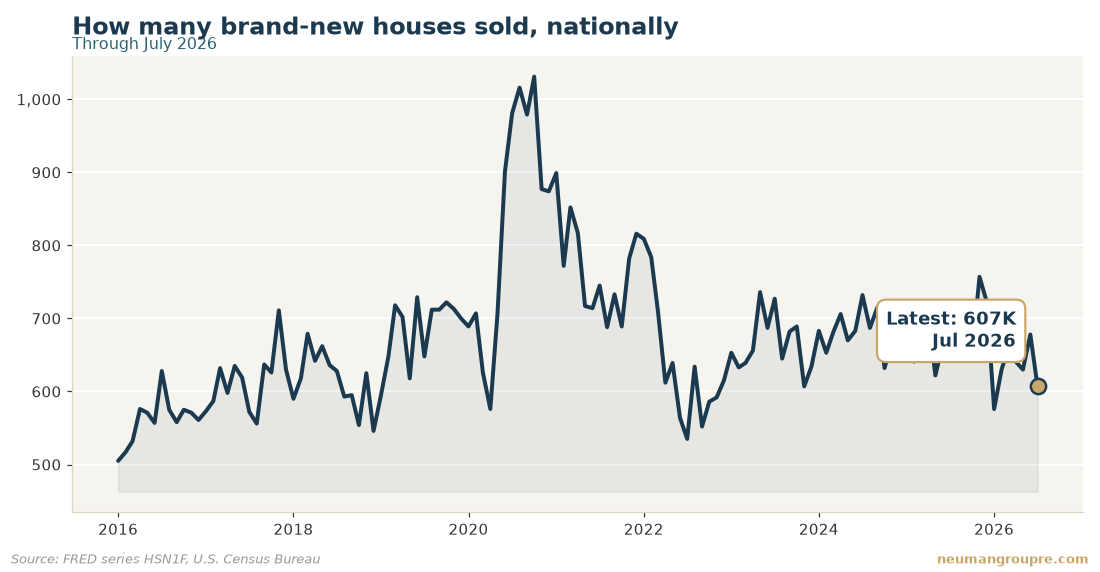
The chart above shows new home sales at 607K for July 2026. That means about 607,000 houses, counted as a yearly pace. That is down from 678K the month before. It is also down from 648K a year ago. So sales have cooled on both counts.
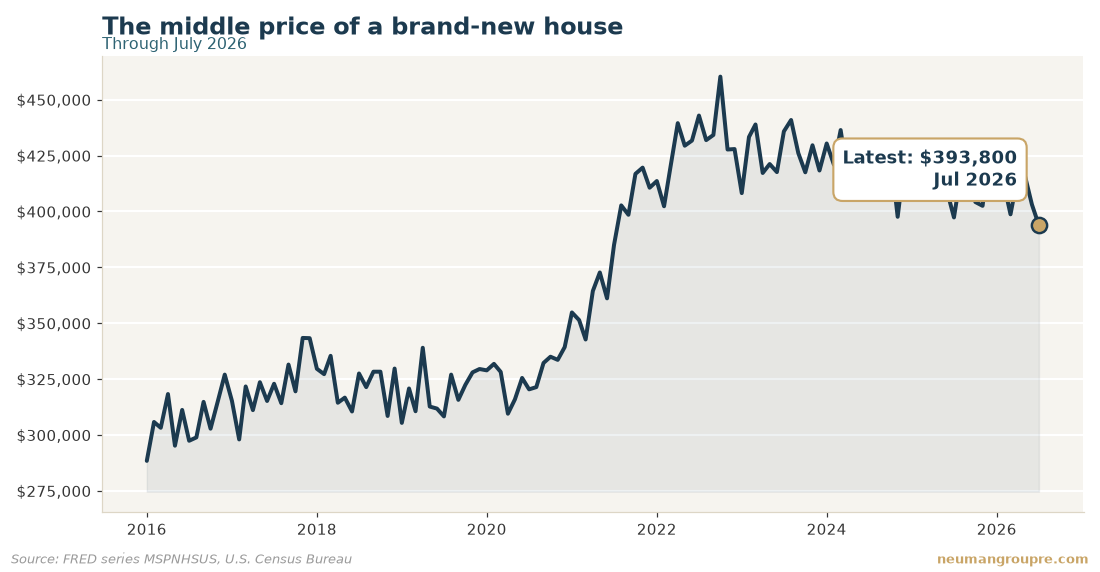
The price chart tells the same story. The middle price of a new house was $393,800 in July 2026. That is down from $403,100 the month before, and down from $397,300 a year ago. When builders cut prices, it usually means they are working harder to find buyers.
What it means for your mortgage payment
When builders struggle to sell, many offer a rate buy-down. That means the builder pays to lower your loan rate for a while. A lower rate means a smaller monthly payment on the same house. On a $600,000 loan, even a small drop in the rate trims what you owe each month. If tomorrow's report is weak, expect more of these builder deals. If it is strong, builders have less reason to offer them.
What it means for home prices
New houses and used houses compete for the same buyers. If a builder down the road slashes prices, sellers nearby often have to match. So a soft new home sales report can nudge prices down across the board. A strong report does the opposite. It gives sellers room to hold firm.
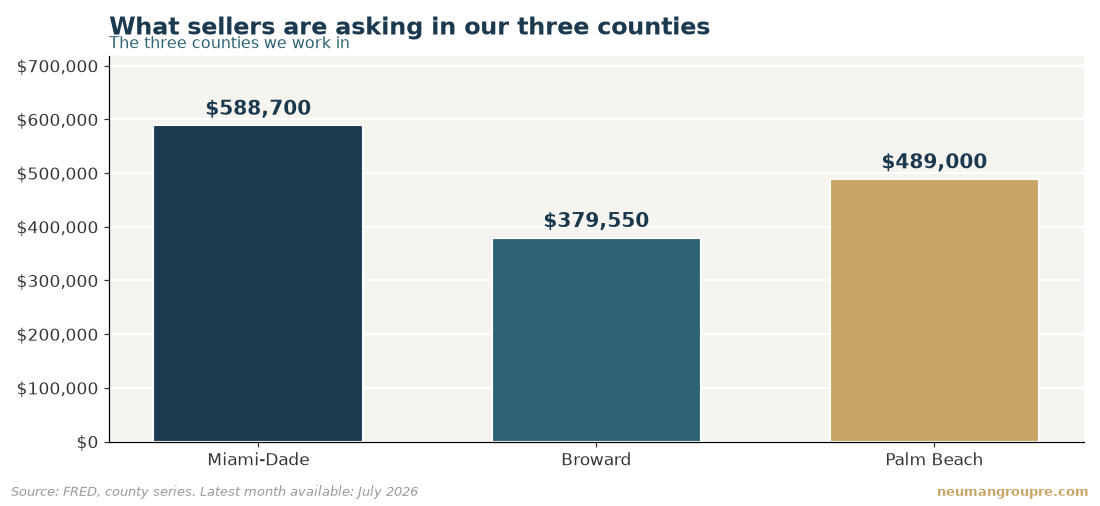
You can see this pressure in South Florida asking prices. The chart above shows what sellers want in our three counties as of August 2026. Miami-Dade sits at $589,000, down from $599,000 a year ago. Broward is at $380,000, down from $400,000. Palm Beach is at $480,000, down from $485,000. All three are lower than a year ago.
What it means for rent
Rent and sale prices are linked. When it costs less to buy, some renters buy instead. That can ease demand for rentals. If you rent out a place, softer sales and lower prices can mean less room to raise the rent. If you rent your home, a cooler market can work in your favor at renewal time.
The bottom line
Tomorrow's number is one more data point in a market that has been cooling. Watch the direction more than any single figure. Falling sales point to more deals for buyers. Rising sales point to firmer prices for sellers.
Have a question about your own home or move? Call The Neuman Group at 954-228-5001, or visit neumangroupre.com.
Three things to watch
What sellers are asking in our three counties
| County | Now | A year ago | Direction |
|---|---|---|---|
| Miami-Dade | $589,000 | $599,000 | down |
| Broward | $380,000 | $400,000 | down |
| Palm Beach | $480,000 | $485,000 | down |
County figures from FRED, latest month published: August 2026.
Questions people ask
What is the new home sales report?
It is a monthly report from the U.S. Census Bureau. It counts how many brand-new houses sold across the country. It also shows the middle price of those houses. It is a quick read on how buyers are feeling.
When does the new home sales report come out?
The next one lands on Thursday, September 24, 2026 at 10:00 a.m. ET. It comes out about once a month. The Census Bureau publishes it.
Why does a national report matter for South Florida?
New and used houses compete for the same buyers. When builders cut prices to move new homes, nearby sellers often follow. So a national slowdown can push local prices down too.
What was the latest new home sales number?
The most recent figure was 607K for July 2026. That is a yearly pace of about 607,000 houses. It was down from 678K the month before and 648K a year ago.
Does this report change my mortgage payment?
Not directly. But weak sales push builders to offer rate buy-downs, which lower your payment. On a $600,000 loan, a lower rate means less owed each month. Strong sales mean fewer of these deals.
Every figure on this page comes straight from FRED (Federal Reserve Economic Data, Federal Reserve Bank of St. Louis) — series HSN1F, MSPNHSUS. We publish these before the report lands so you can read the background while it is still quiet, then we add the actual number here the moment it is out.
Call 954-228-5001 or ask us for a free read on your property.