New Home Sales Report, June 2026: What to Watch Aug 25
Comes out: Tuesday, August 25, 2026 at 10:00 a.m. ET
Published by: U.S. Census Bureau
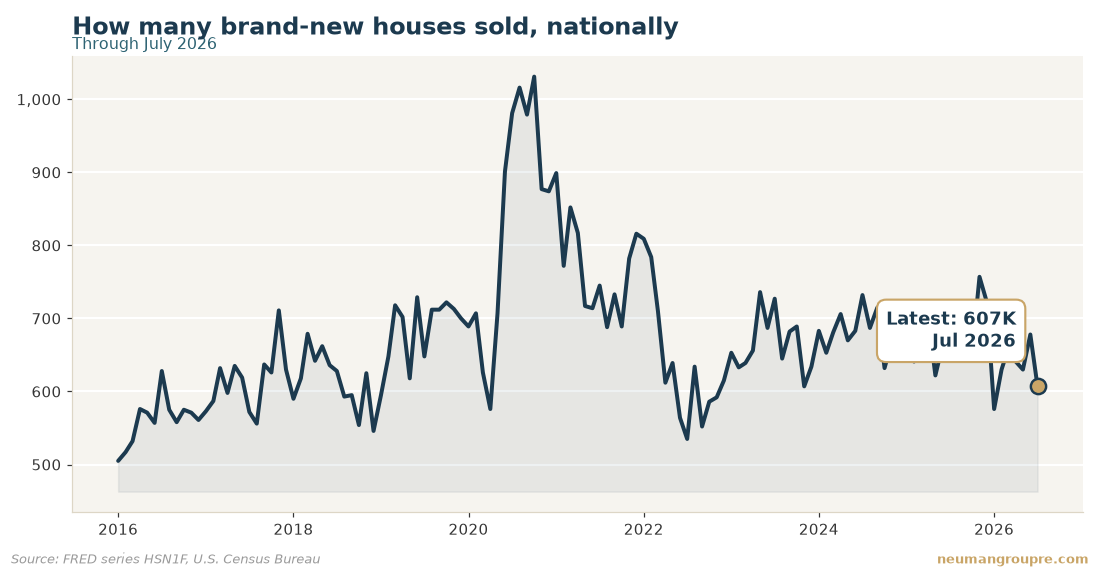
New home sales dropped to 607K in July, down from 678K
607,000 brand-new houses sold across the country in July 2026. That is the yearly pace of new-home sales. It was 678,000 the month before, so sales slowed. A year ago the pace was 648,000, so sales are down from last year too.
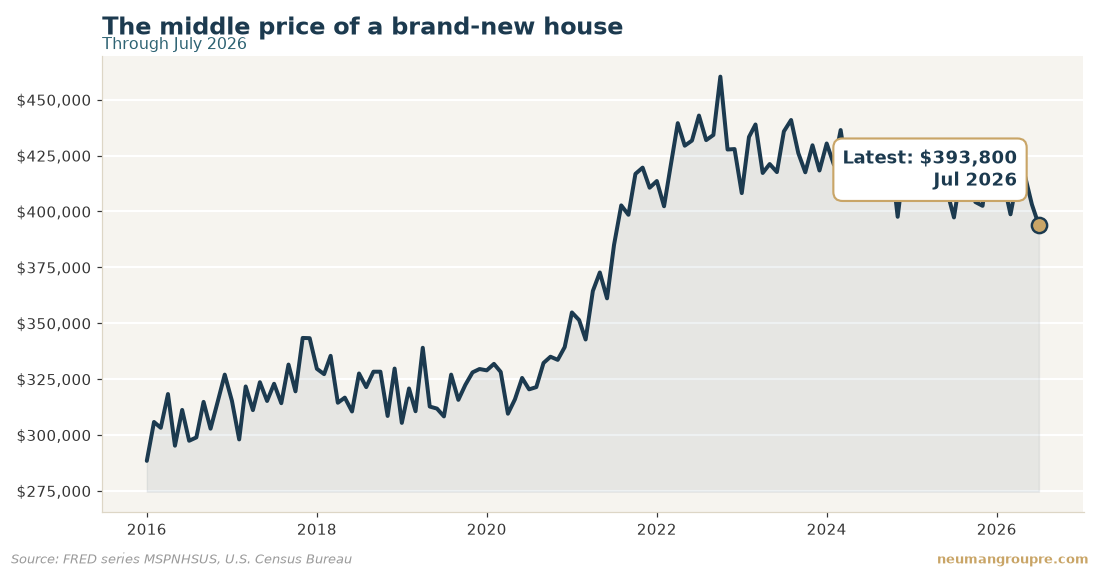
The middle price of a new house also came down. It was $393,800 in July. That is down from $403,100 the month before, and down from $397,300 a year ago. ("Middle price" means half of new houses cost more and half cost less.)
Here is why this matters. Builders only sell when buyers can afford the monthly payment. When fewer new houses sell, builders start cutting prices and helping with lower loan costs to move what they have built.
If you are buying in South Florida, this gives you room to ask. When a builder near you is offering a deal, sellers of nearby used homes often have to match it. If you are selling, price it right the first week, because you are competing with those builder discounts. If you already own, one soft month does not set your home's value; the bigger story is prices easing a little all year.
Want to know what this means for your street? Call The Neuman Group at 954-228-5001.
On Tuesday, August 25, 2026 at 10:00 a.m. Eastern Time, the U.S. Census Bureau puts out its New Residential Sales report. It is often just called the new home sales report. It counts how many brand-new houses sold across the country.
Nobody knows tomorrow's number yet. But it can nudge home prices, rents, and mortgage rates. That includes right here in Miami-Dade, Broward, and Palm Beach.
This page explains what the report measures, what the charts above are already showing, and what each possible result would mean for your money.
What this report actually measures
The report tracks brand-new houses only. Not older homes that people resell. When a builder puts up a new house and a buyer signs to buy it, that sale gets counted.
It matters because builders watch buyers closely. Builders sell when buyers can afford the monthly payment. When sales slow down, builders react. They cut prices. They offer rate buy-downs, which means they pay to lower your mortgage rate for a while. Those deals pull prices down for everyone selling nearby, not just the new houses.
What the charts show right now
The chart above shows how many new houses sold across the country. The latest count is 628K for June 2026. That is up from 618K the month before. So more new houses sold than the prior month. But it is down from 665K a year ago. So the year-over-year trend is still lower.
The chart above also shows the middle price of a new house. The middle price means half of the houses cost more and half cost less. It is $398,300 for June 2026. That is down from $412,000 the month before. It is also down from $409,200 a year ago. So new-house prices have been sliding.
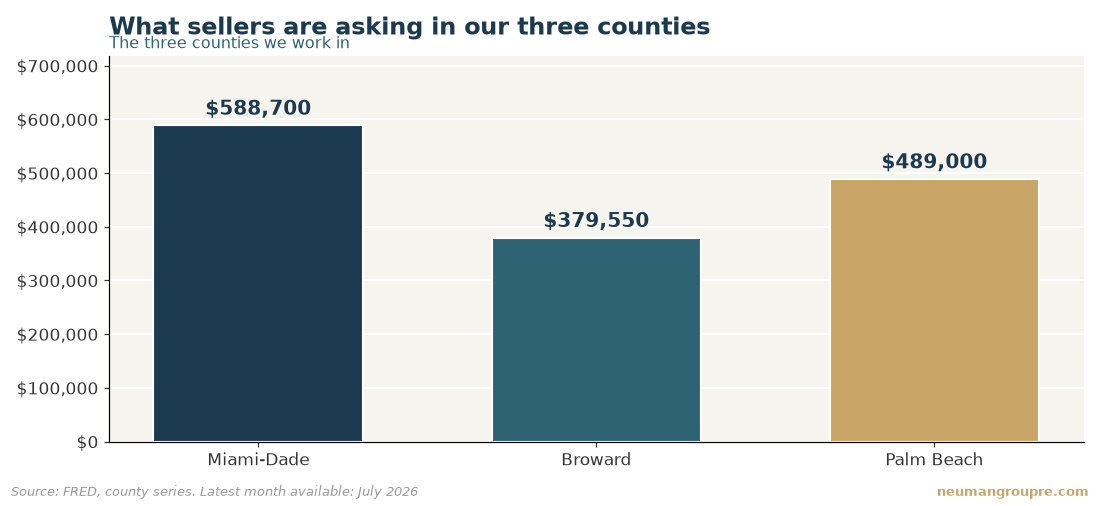
Closer to home, the chart above shows what sellers are asking in our three counties in July 2026. Miami-Dade is at $588,700, down from $600,000 a year ago. Broward is at $379,550, down from $408,275 a year ago. Palm Beach is at $489,000, down from $495,000 a year ago. All three are lower than a year ago.
What it means for your mortgage payment
The report can move mortgage rates a little. A mortgage rate is the yearly cost of borrowing the money to buy a home. When rates go down, your monthly payment goes down too. When rates go up, your payment goes up.
On a $600,000 loan, even a small rate change moves your payment. Lower rates mean you pay less each month for the same house. So if this report points to a softer housing market, that can gently push rates down, and that helps buyers.
What it means for home prices
New houses and resale houses compete for the same buyers. If builders keep cutting prices to move new homes, sellers of older homes often have to follow. That is good news if you are buying. It is harder if you are selling and need top dollar.
What it means for rent in South Florida
When more new homes get built and sold, some renters buy instead. That can ease the pressure on rents over time. If building slows, fewer new places open up, and rents can stay firm. If you own a place and rent it out, watch the count above. A steady flow of new homes can give renters more choices.
The bottom line
You do not need to guess the number. Just watch the direction. More sales and steadier prices point to a stronger market. Fewer sales and bigger price cuts point to a softer one that favors buyers. Either way, we can walk you through what it means for your street. Call The Neuman Group at 954-228-5001.
Three things to watch
What sellers are asking in our three counties
| County | Now | A year ago | Direction |
|---|---|---|---|
| Miami-Dade | $588,700 | $600,000 | down |
| Broward | $379,550 | $408,275 | down |
| Palm Beach | $489,000 | $495,000 | down |
County figures from FRED, latest month published: July 2026.
Questions people ask
What is the new home sales report?
It is a monthly count from the U.S. Census Bureau of how many brand-new houses sold across the country. It only counts new construction, not resales of older homes. It also reports the middle price of those new houses.
When does the next new home sales report come out?
It comes out Tuesday, August 25, 2026 at 10:00 a.m. Eastern Time. The Census Bureau publishes it. The numbers on this page will update once it lands.
How does this report affect mortgage rates?
It is one piece of housing data that markets watch. A weaker report can gently push mortgage rates down. A stronger one can push them up. The move is usually small, but it adds up on a big loan.
Does this national report matter for South Florida?
Yes. New and older homes compete for the same buyers everywhere, including Miami-Dade, Broward, and Palm Beach. When builders cut prices, nearby sellers often follow. The chart above shows local asking prices in all three counties are down from a year ago.
Is now a good time to buy or sell?
It depends on your own budget and plans, not one report. Watch the direction of sales and prices over a few months. A local agent can show you what is happening on your specific street. Call The Neuman Group at 954-228-5001.
Every figure on this page comes straight from FRED (Federal Reserve Economic Data, Federal Reserve Bank of St. Louis) — series HSN1F, MSPNHSUS. We publish these before the report lands so you can read the background while it is still quiet, then we add the actual number here the moment it is out.
Call 954-228-5001 or ask us for a free read on your property.