GDP Report August 2026: What It Means for You
Comes out: Wednesday, August 26, 2026 at 8:30 a.m. ET
Published by: U.S. Bureau of Economic Analysis
A big report on the U.S. economy comes out on Wednesday, August 26, 2026, at 8:30 a.m. Eastern Time. It is called Gross Domestic Product, or GDP for short. The government office that puts it out is the U.S. Bureau of Economic Analysis.
GDP is one number that adds up the value of everything the country makes and sells. Think of it as a scoreboard for the whole economy. When it goes up, the economy grew. When it goes down, the economy shrank.
Why should you care if you live in Miami-Dade, Broward, or Palm Beach? Because this one number quietly shapes home prices, rent, and the cost of a mortgage. This page explains what to watch for before the number is out.
What this report actually measures
GDP counts the value of all the goods and services the country produces. Cars, haircuts, houses, phone plans, doctor visits. Add it all up and you get GDP.
The number we care about is Real GDP. "Real" just means the government took out inflation. Inflation is the general rise in prices over time. Taking it out lets you see if the economy really grew, or if prices just went up. That is a fairer way to compare one time to another.
What the charts show right now
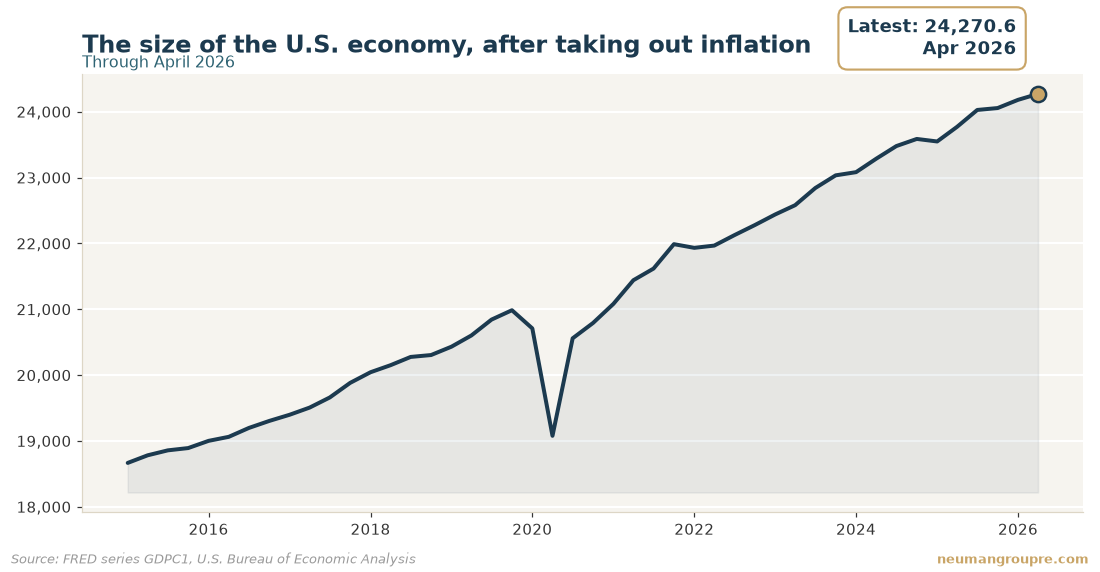
The chart above shows the size of the U.S. economy over time. The most recent value is 24,270.6, for April 2026. The time before that it was 24,180.4. A year ago it was 23,771.0.
So the line is moving up. The economy is bigger than it was last time, and bigger than it was a year ago. That is a steady, growing picture, not a shrinking one. The report on Wednesday adds the next point to that line. The big question is whether the line keeps rising, slows down, or turns lower.
What it means for your mortgage payment
GDP does not set mortgage rates by itself. But it shapes the mood of lenders. When the economy looks strong, lenders and investors often expect higher rates to keep prices in check. When the economy looks weak, rates often ease as a way to help things along.
Even a small move in rates changes real money on a big loan. On a $600,000 home loan, a rate that is even a little higher raises your monthly payment. A rate that is a little lower lowers it. Over 30 years, those small moves add up to a lot. So the tone of this report can reach all the way to your monthly budget.
What it means for home prices
A growing economy usually keeps buyers confident. People feel steady about their jobs and their pay, so they are more willing to make an offer. More buyers competing tends to hold prices up or push them higher.
A weak or shrinking economy does the opposite. Buyers get cautious. Some wait. When fewer people are bidding, sellers may need to price more carefully, and homes can sit longer before they sell.
What it means for rent in South Florida
Rent follows jobs and confidence too. When the economy grows, more people move here for work and can afford to rent, which keeps demand for rentals firm. When the economy slows, some people double up or hold off on moving, which can cool rent growth.
If you own a place and rent it out, this matters for how fast it fills and what you can charge. If you are the one renting, a slower economy can mean a little more room to negotiate at renewal time.
The bottom line
You do not need to guess Wednesday's exact number. You just need to know which way it points. Up means the economy is still growing. A drop means it is losing steam. Either way, it ripples into the price of a home, the cost of a loan, and the rent you pay or collect. If you are weighing a move in South Florida, we are glad to talk it through at 954-228-5001.
Three things to watch
Questions people ask
What is GDP in simple terms?
GDP adds up the value of everything the country makes and sells. It is a scoreboard for the whole economy. When it rises, the economy grew. When it falls, it shrank.
When does the GDP report come out?
It comes out on Wednesday, August 26, 2026, at 8:30 a.m. Eastern Time. The U.S. Bureau of Economic Analysis publishes it.
Does GDP set my mortgage rate?
Not directly. But it shapes how lenders feel about the economy. A strong report can keep rates higher, and a weak one can push them lower. That flows into the rate you are offered.
What does 'real' GDP mean?
Real GDP has inflation taken out. Inflation is the general rise in prices. Removing it shows whether the economy truly grew, instead of just prices going up.
How does this affect home prices in South Florida?
A growing economy keeps buyers confident, which tends to support prices. A weak economy makes buyers cautious, which can soften prices and leave homes on the market longer.
Every figure on this page comes straight from FRED (Federal Reserve Economic Data, Federal Reserve Bank of St. Louis) — series GDPC1. We publish these before the report lands so you can read the background while it is still quiet, then we add the actual number here the moment it is out.
Call 954-228-5001 or ask us for a free read on your property.