Existing Home Sales Report: July Data Lands Aug 11
Comes out: Tuesday, August 11, 2026 at 10:00 a.m. ET
Published by: National Association of Realtors
Home sales slip to 4,060,000 in July 2026
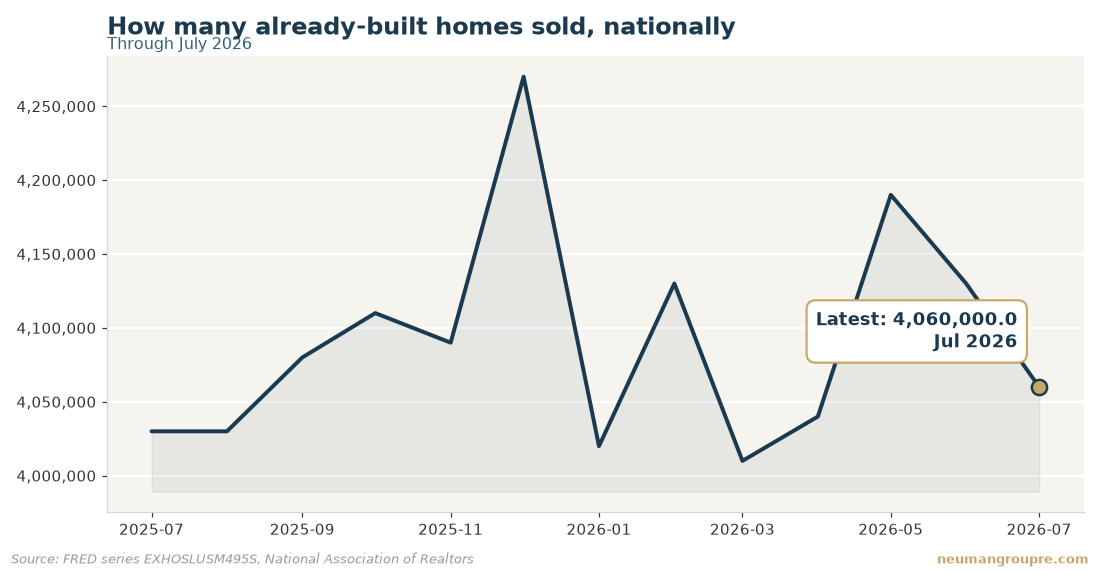
4,060,000 already-built homes sold across the country in July 2026. This number counts homes that regular people sold to other regular people. It is the best sign of whether buyers are really out shopping.
That is down from 4,130,000 the month before. So about 70,000 fewer homes changed hands than last time. Compared with a year ago, though, it is up a little. Last year the number was 4,030,000, so about 30,000 more homes sold this July.
In plain words: buying slowed down a touch from last month, but it is still a bit busier than the same time last year. This is a national count, not a South Florida count, but it hints at how much company you will have when you shop or list.
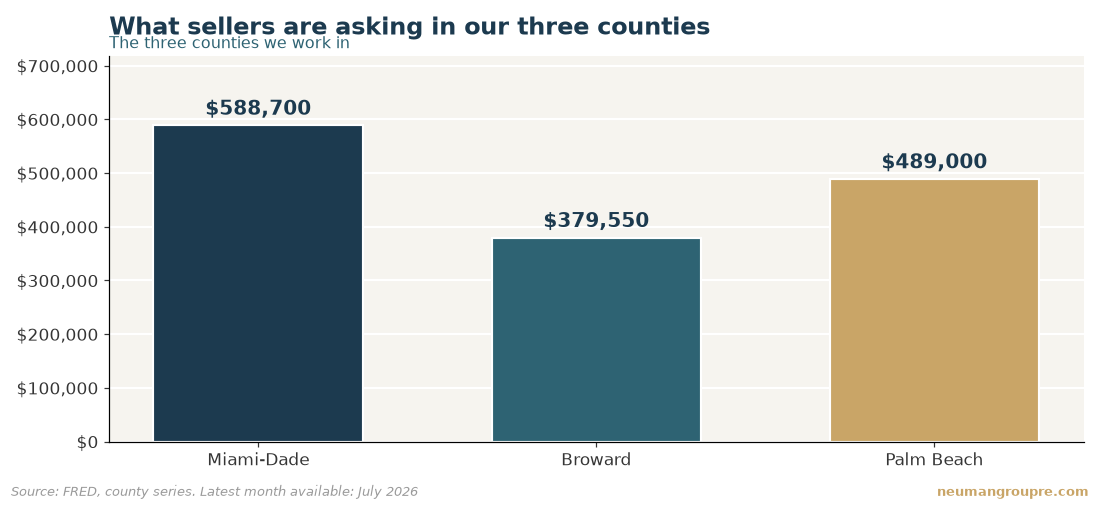
If you are a buyer, a slower month can mean less competition on a house you like. That can give you more room to ask for a lower price or a small repair. Here at home, asking prices have eased over the past year. In Broward, sellers are asking $379,550, down from $408,275 a year ago. In Miami-Dade it is $588,700, and in Palm Beach it is $489,000.
If you are a seller, fewer sales means you may wait a bit longer and price with care. A fair asking price and a clean, ready home still move. Questions about your street or building? Call The Neuman Group at 954-228-5001.
A new home sales report comes out on Tuesday, August 11, 2026 at 10:00 a.m. Eastern time. It is called Existing Home Sales, and it is put out by the National Association of Realtors, a large group that tracks home sales.
This report counts homes that regular people sold to other regular people. In plain words, it is the best sign of whether buyers are actually showing up and signing deals.
You should care because this number moves the mood of the whole housing market. It can nudge home prices, rents, and the cost of a mortgage. Below we explain what to watch for, so you already understand the number the moment it lands.
What this report actually measures
Existing Home Sales counts already-built homes that changed hands. It does not count brand-new houses. Think of a normal house or condo that one owner sold to a new owner.
The report is given as a yearly pace. That means it takes the sales from one month and stretches the math out as if the whole year kept that speed. So a number like 4.09 million does not mean 4.09 million homes sold in one month. It is a steady yearly rate built from one month of sales.
What the charts show right now
The chart above shows the national sales pace. The most recent reading is 4,090,000 for June 2026. That was down from 4,190,000 the month before. So the pace slowed from the prior month.
But compare it to a year earlier and the picture flips. A year ago the pace was 3,980,000. So sales are up from where they were 12 months ago. In short, slower than last month, but stronger than last year.
The South Florida chart shows what sellers are asking in our three counties. These are asking prices, meaning the sticker price, not the final sold price. In Miami-Dade the asking price is $588,700 as of July 2026, down from $600,000 a year ago. In Broward it is $379,550, down from $408,275 a year ago. In Palm Beach it is $489,000, down from $495,000 a year ago. All three are lower than a year ago.
What it means for your mortgage payment
This report does not set mortgage rates. But it feeds the story lenders and investors watch. When sales look weak, it can push rates lower over time. When sales look hot, it can push rates higher.
Why does that matter? On a $600,000 loan, even a small move in the rate changes your monthly payment by a real amount every single month for years. So the direction of this report can quietly touch what you pay.
What it means for home prices
Sales and prices are linked. When lots of buyers are active, sellers hold firm or raise prices. When buyers pull back, sellers often cut. The chart above already shows asking prices in all three counties sitting below where they were a year ago. A strong national number could slow those price cuts. A weak one could keep prices soft.
What it means for rent in South Florida
Rent and home sales lean on each other. When buying is hard, more people rent, and that can hold rents up. When buying gets easier, some renters become buyers, and that can ease rent pressure. If you own a place and rent it out, a sales slowdown can mean steady demand for your unit. If you rent, a sales pickup could give you a bit more room to negotiate.
How to read the new number
Do not focus only on the raw figure. Look at the direction. Is the pace higher or lower than last month? Is it higher or lower than a year ago? Those two comparisons tell you more than the single number does. We will update the charts once the new report is out.
Three things to watch
What sellers are asking in our three counties
| County | Now | A year ago | Direction |
|---|---|---|---|
| Miami-Dade | $588,700 | $600,000 | down |
| Broward | $379,550 | $408,275 | down |
| Palm Beach | $489,000 | $495,000 | down |
County figures from FRED, latest month published: July 2026.
Questions people ask
What is the Existing Home Sales report?
It counts already-built homes that sold, like a normal house or condo passed from one owner to the next. It does not count brand-new construction. It is the best read on whether buyers are really showing up.
When does the report come out?
It comes out on Tuesday, August 11, 2026 at 10:00 a.m. Eastern time. It is released by the National Association of Realtors. We will refresh the charts on this page once the number is public.
Why is the number in the millions if that many homes did not sell in one month?
The report uses a yearly pace. It takes one month of sales and projects it out as if the year kept that speed. So 4.09 million is a steady yearly rate, not one month of sales.
Does this report change my mortgage payment?
Not directly. It does not set rates. But it shapes the market mood that helps push rates up or down over time. On a large loan, even a small rate move changes your monthly payment.
What does it mean for South Florida prices right now?
The chart above shows asking prices in Miami-Dade, Broward, and Palm Beach all sitting below where they were a year ago. A strong national number could slow those cuts, while a weak one could keep prices soft.
Every figure on this page comes straight from FRED (Federal Reserve Economic Data, Federal Reserve Bank of St. Louis) — series EXHOSLUSM495S. We publish these before the report lands so you can read the background while it is still quiet, then we add the actual number here the moment it is out.
Call 954-228-5001 or ask us for a free read on your property.